Calculation of sea surface height anomaly
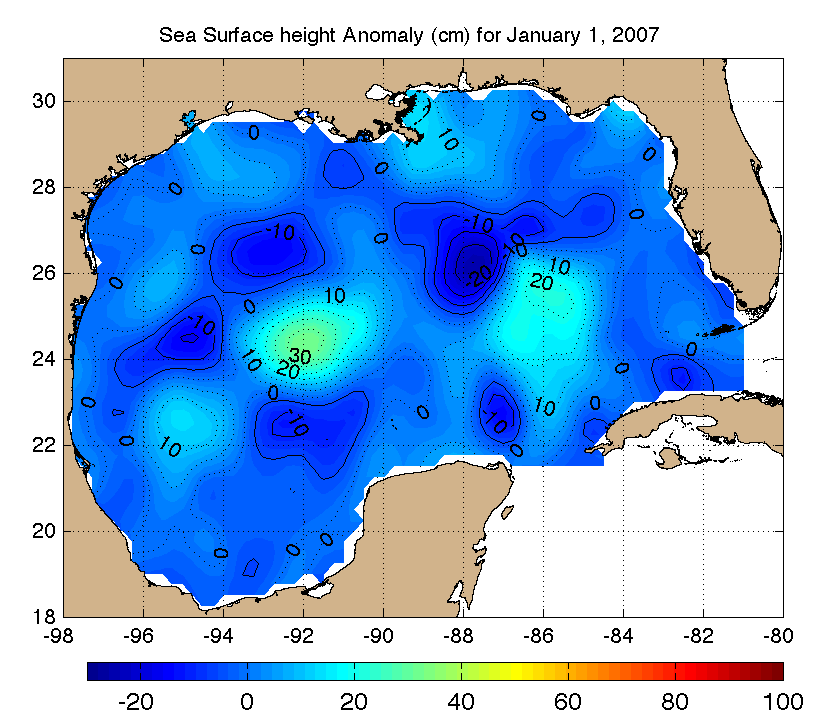
The sea surface height anomaly (SSHa) for a specific day can be determined by using the formula provided by Robert Leben ( leben@colorado.edu). The formula calculates the SSHa relative to the AVISO mean sea surface CLS 11.
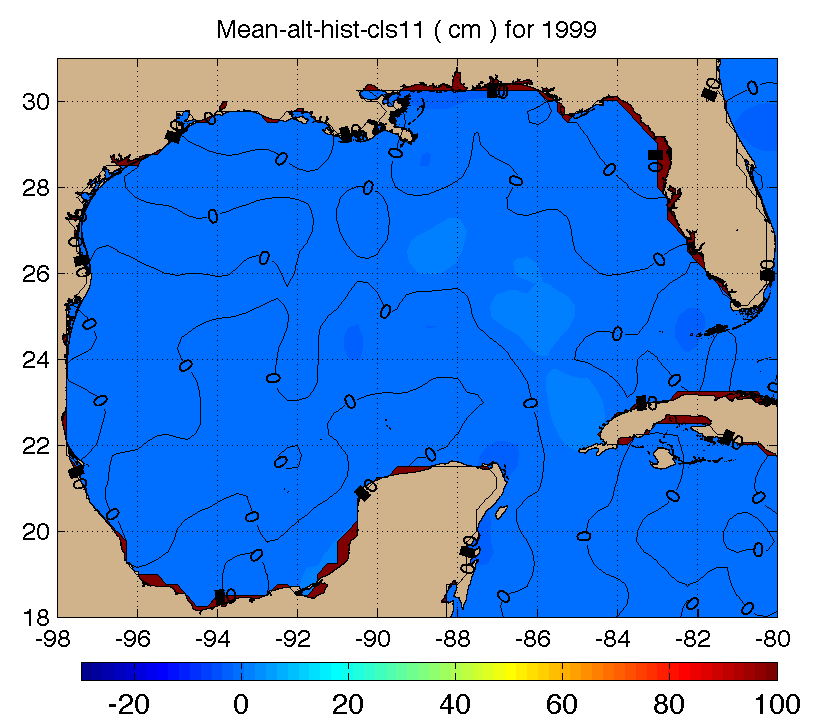
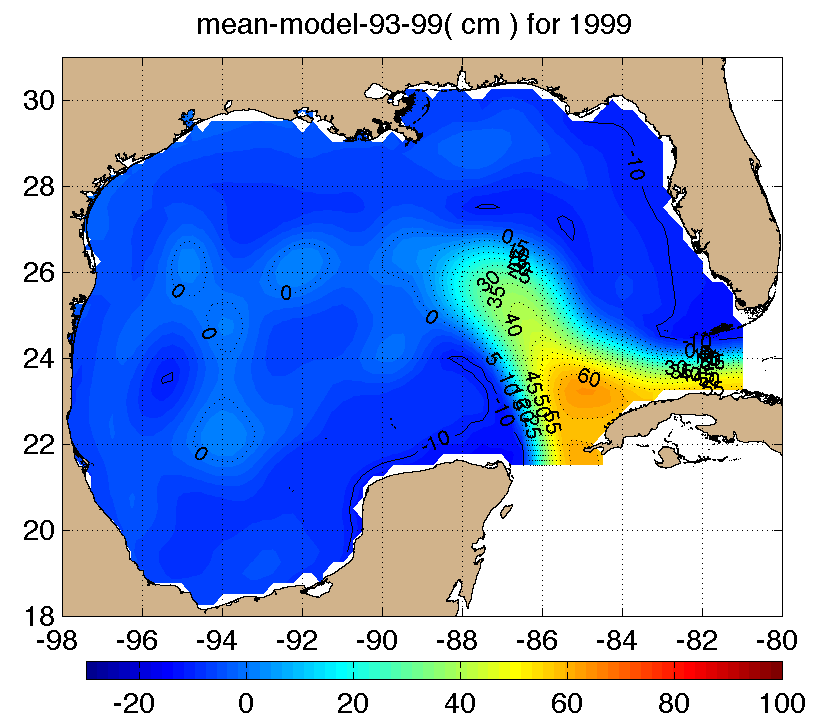
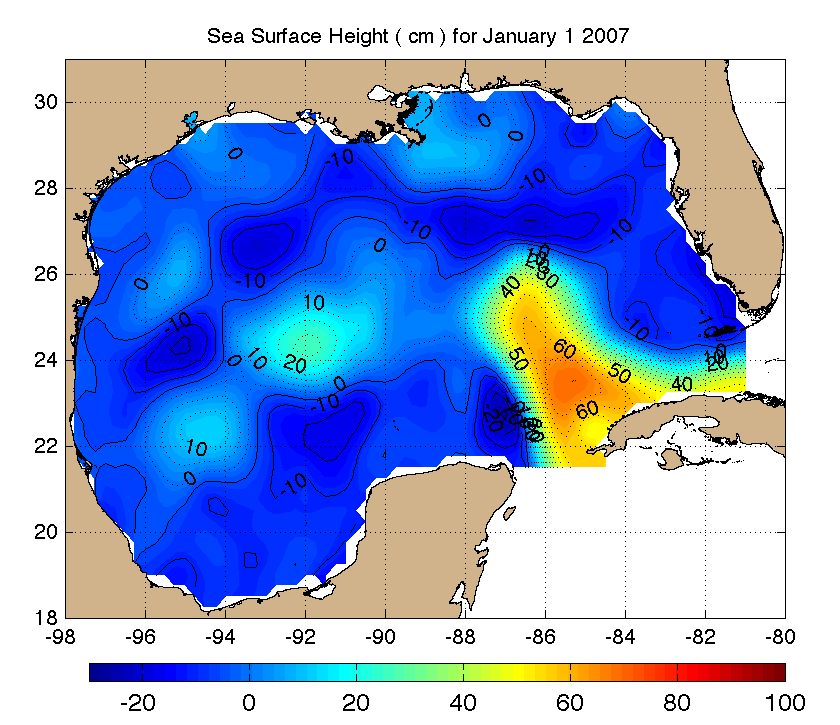
SSHa = SSH + mean_alt_hist_cls11_1993_1999 - mean_model_93_99.
The 3 terms needed are:
- the gridded sea surface height (SSH) for the day in question,
- the mean of the yearly mean sea surface height anomaly (SSHa) for the time period 1/1/1993 -12/31/1999 (mean_alt_hist_cls11_1993_1999),
- the mean sea surface height for the time period 1/1/1993 -12/31/1999, which was calculated with the University of Colorado Gulf of Mexico model (CUPOM).
Both files (2, 3) are provided below in netcdf format. The files contain Longitude (280° - 262°, with 0.25° spacing), Latitude (31° – 18° N with 0.25° spacing), and sea surface height anomaly data in cm.
mean_alt_hist_cls11_1993_1999.nc
For more information:
Leben R.R, G.H. Born, B.R. Engelbrecht. 2002. Operational Altimeter Data Processing for Mesoscale Monitoring, Marine Geodesy, 25:3-18
In order to better visualize the difference between SSH and SSHA, 5 graphs have been created.
Mean historical ssha data, Mean ssh model data, SSH, SSH + Mean historical ssh and SSHa.